Why Statistics Matter
It is quite ironic that machine learning is built on statistics, because we seem to forget this the moment benchmarking is involved.
Most eval tools don't help users perform any statistical tests. They present bar charts of average performance. Developers glance at the bar chart and declare "model A beats model B." But does it, really? Model B might be more robust. It might perform well on an important subset of the data. Or there simply isn't enough data to conclude one way or the other.
The challenge is that AI evals are still new to most developers. People are still learning the basics of how to design good evals—like iterative error analysis —let alone how to analyze eval results statistically. But the stakes are high. Evals are increasingly used to make important decisions about which models, prompts, and agents to deploy, and we need to make informed decisions, not just snap judgments based on eyeballing plots of limited data. It's not right that out of 445 benchmarks, only 16% conducted any statistical tests. We need statistics. But which ones, and how?
I'm compiling this guide to share the insights I've gained from months of research into statistical methods
for LLM evals, and from building evalstats — a Python library that implements sane defaults
for statistical analysis of eval results. I started this project because I was frustrated by the lack of
clear guidance on how to analyze eval results, and by the prevalence of misleading or inappropriate statistical
methods in the wild.
My goal is to find reasonable defaults for eval statistics, grounded in research and simulation evidence
rather than conventions, hype, or—yes—listening to what an LLM says.
I'll share my learnings here, and update the guide as I continue to learn.
This guide is actively being developed. If you'd like regular updates as new sections, simulations, and recommendations are added, subscribe to the newsletter: substack.com/@statsforevals
Design of this Guide
This guide is designed to be practical and actionable. I want developers to be able to read it and immediately apply the recommendations to their evals, without needing a PhD in statistics or spending hours reading research papers. Thus, I aim to focus on clear principles, concrete recommendations, and intuitive explanations, rather than on mathematical details or theoretical justifications. That said, I will ground my recommendations in research and simulations whenever possible, and I'll provide links to relevant papers and resources for readers who want to dive deeper.
There are three types of "users" of this guide, as I see it:
- Developers who want quick, no-nonsense defaults wrapped in an API, so they can run eval statistics without having to think too hard about which test to choose.
- Developers who want to learn statistics for LLM evals, so they can choose and apply methods more rigorously in their specific evals stack.
- Researchers and practitioners of AI evaluation, who want to understand the statistical properties of different methods and see empirical evidence for which methods work best in which LLM evals contexts (and potentially write/run their own simulations to check this).
Thus, I'm using evalstats as a pioneer implementation of the principles and recommendations in this guide.
The library is designed to be easy to use for the first group of users, but it also makes the example notebooks more concise for the second and third groups.
That said, you can get something from this guide without using the library.
The evalstats Library
evalstats implements all of the above defaults out of the box. You pass it data,
it runs the most appropriate statistics given your data format and structure, and it produces
a human-readable report.
pip install evalstats
When method="auto" (the default), evalstats picks the most
appropriate method based on your data type and sample size.
See Which Method? for the full decision logic and
simulation evidence behind these defaults.
Comparing prompts
Pass a dict mapping prompt labels to per-input score arrays.
compare_prompts tests all pairs and applies multiple-comparisons correction.
import numpy as np
import evalstats as estats

scores = {
    "zero-shot":        np.array([0.80, 0.90, 0.70, ...]),
    "few-shot":         np.array([0.85, 0.92, 0.75, ...]),
    "chain-of-thought": np.array([0.60, 0.70, 0.65, ...]),
}

report = estats.compare_prompts(scores)
report.summary()
Comparing models
Same interface, one key per model. Works with a single prompt template or with no templates.
import numpy as np
import evalstats as estats

scores = {
    "gpt-4o-mini": np.array([0.82, 0.91, 0.78, ...]),
    "gemma-3-4b":  np.array([0.75, 0.84, 0.71, ...]),
}

report = estats.compare_models(scores)
report.summary()
Comparing models and prompts together
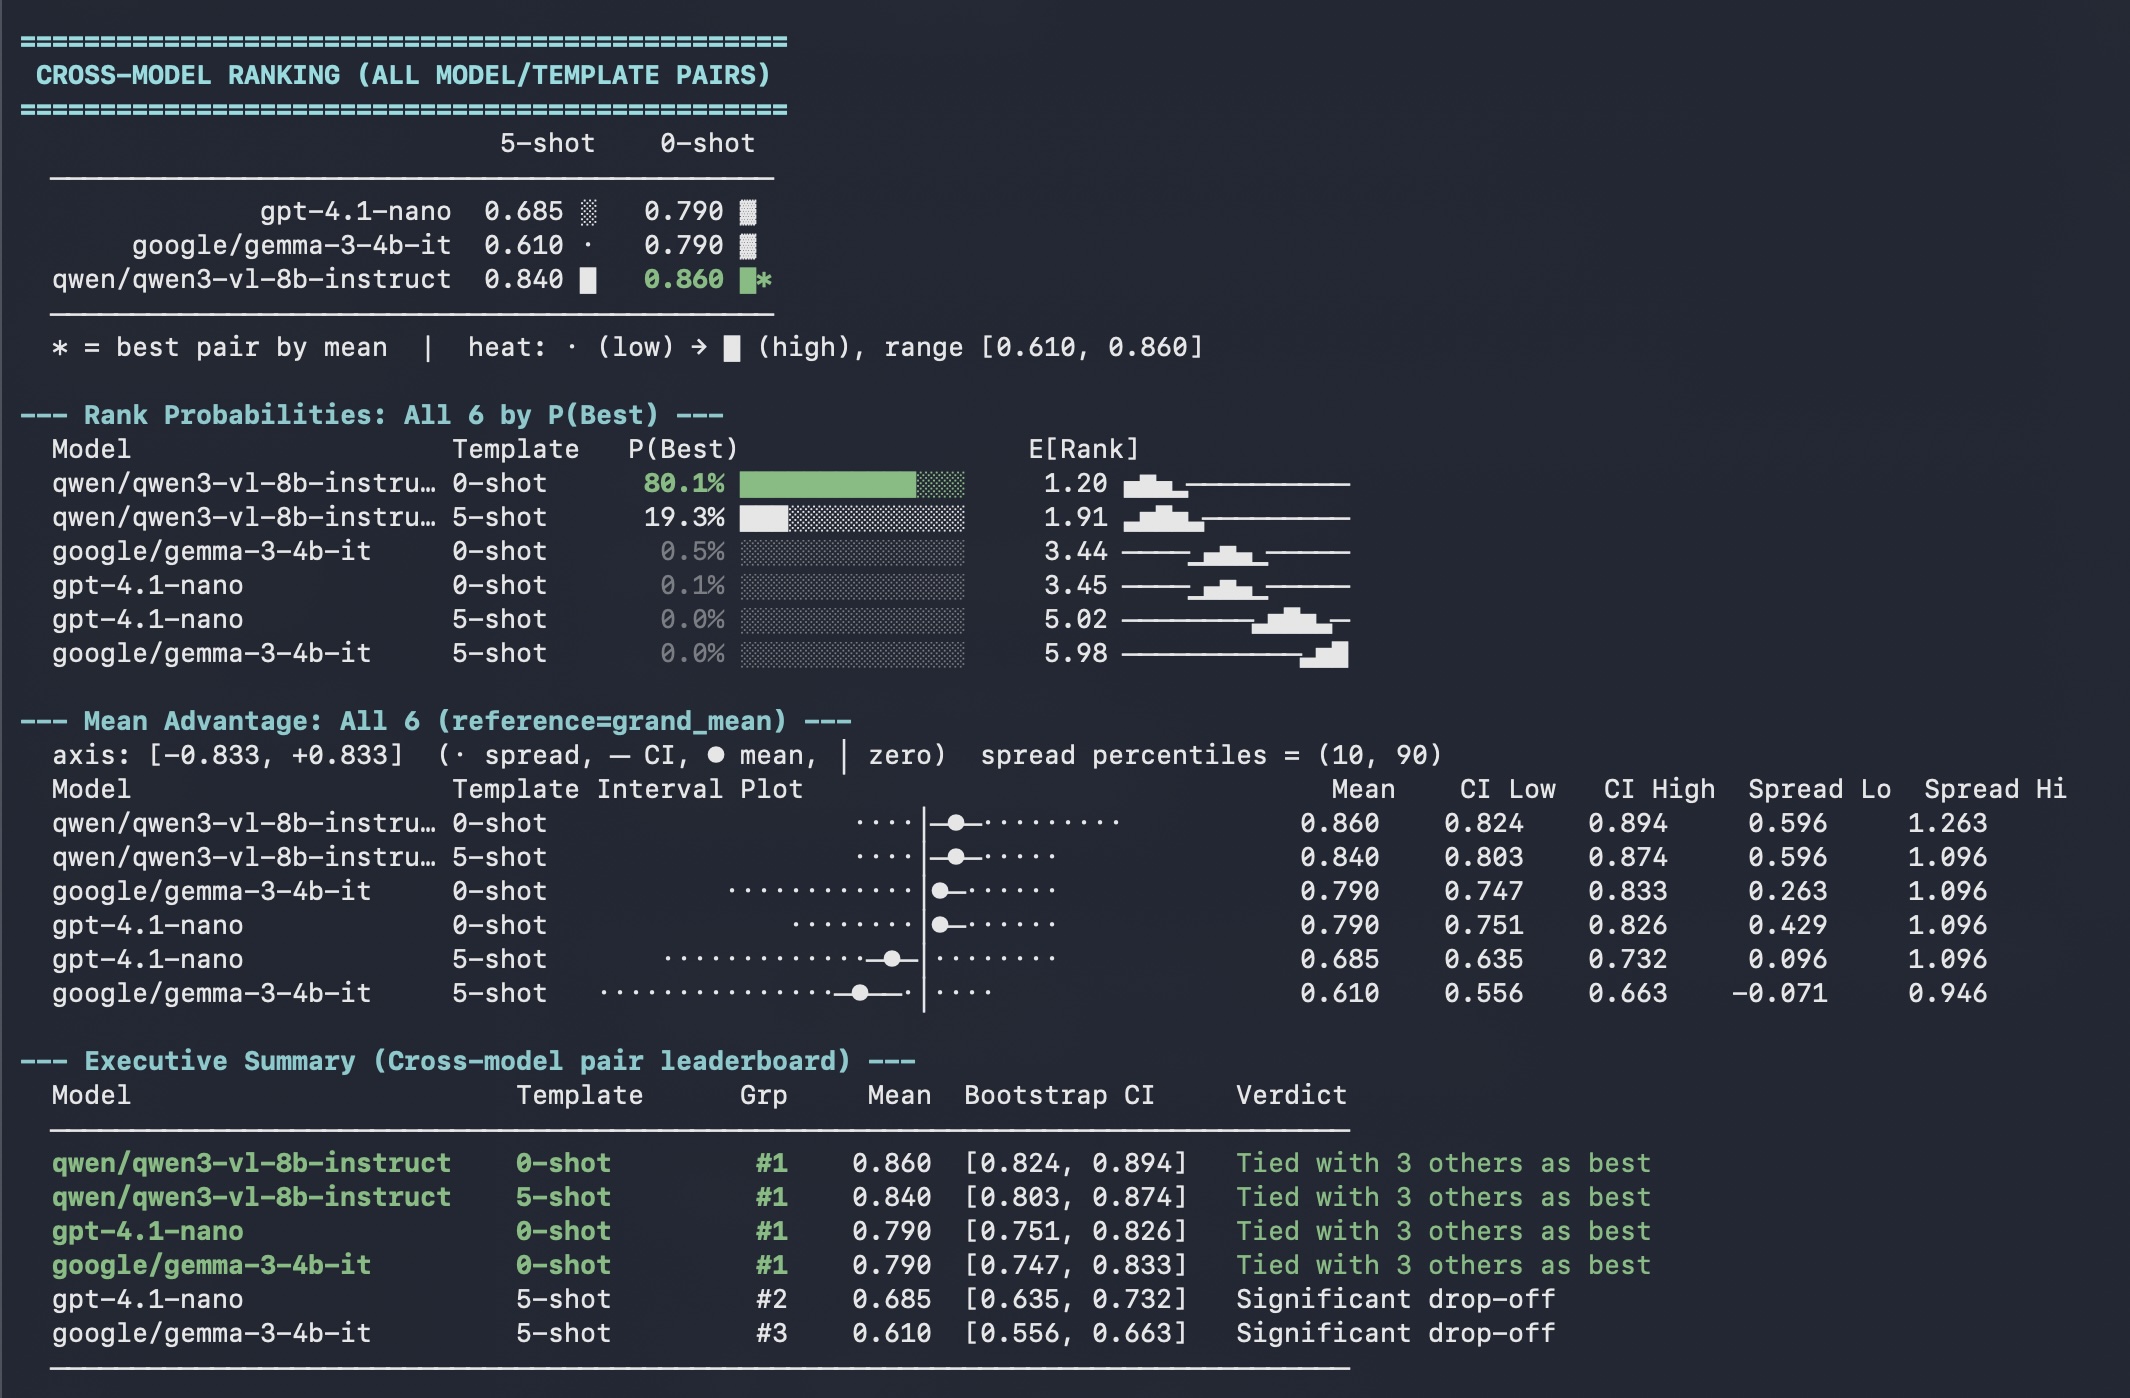
When each model is tested on multiple prompt templates, nest the dict one level deeper.
compare_models ranks all model × prompt pairs and reports
simultaneous CIs across the full grid.
import numpy as np
import evalstats as estats

scores = {
    "gpt-4.1-nano": {
        "5-shot": np.array([0.79, 0.85, 0.83, ...]),
        "0-shot": np.array([0.61, 0.73, 0.69, ...]),
    },
    "gemma-3-4b-it": {
        "5-shot": np.array([0.68, 0.77, 0.72, ...]),
        "0-shot": np.array([0.60, 0.72, 0.65, ...]),
    },
    "qwen3-v1-8b-instruct": {
        "5-shot": np.array([0.84, 0.86, 0.88, ...]),
        "0-shot": np.array([0.86, 0.87, 0.85, ...]),
    },
}

report = estats.compare_models(scores)
report.full_summary()
Example terminal output:
More complete, runnable examples are in the
examples/ folder on GitHub.
Using the CLI (no Python required)
Don't want to write Python? evalstats ships a command-line interface that reads
a CSV or Excel file and prints the full statistical report directly in your terminal.
evalstats analyze results.csv
For multi-model comparison, use a long/tidy format CSV with at minimum
model, prompt, input, and score columns:
| model | prompt | input | score |
|---|---|---|---|
| gpt-4o-mini | 5-shot | ex_1 | 0.85 |
| gpt-4o-mini | 5-shot | ex_2 | 0.72 |
| gpt-4o-mini | 0-shot | ex_1 | 0.61 |
| gpt-4o-mini | 0-shot | ex_2 | 0.54 |
| gemma-3-4b | 5-shot | ex_1 | 0.77 |
| gemma-3-4b | 5-shot | ex_2 | 0.69 |
| gemma-3-4b | 0-shot | ex_1 | 0.60 |
| gemma-3-4b | 0-shot | ex_2 | 0.55 |
| … | … | … | … |
The CLI auto-detects the format. You can also pass an Excel file and specify a sheet, save outputs to a file, or tweak the confidence level:
# Excel file, non-default sheet
evalstats analyze results.xlsx --sheet "Eval Results"

# Save a Markdown summary and a mean-advantage plot
evalstats analyze results.csv --out report.md plot.png

# 95 % CIs instead of the default 99 %
evalstats analyze results.csv --ci 0.95
Column name aliases are accepted for convenience — e.g. template instead of
prompt, item instead of input, or value
instead of score. Run evalstats analyze --help for the full list.
For more details and example usage, check out the Example Usage page.
Who Am I?
I'm Ian Arawjo, a researcher and software engineer focused on AI evaluation and human-computer interaction (HCI). In the past, I've conducted research in LLM evaluation, creating tools like ChainForge and EvalGen that had an influence on the design of evals platforms and pipelines, including LangSmith, Chroma, and Weights and Biases. In my day job, I'm an Assistant Professor of HCI in the Computer Science and Operations Research department at Université de Montréal, which inherited a lot of experiment design from psychology. I teach a graduate-level empirical methods course, including statistical analysis of experiment data with methods like mixed effects models.
Why are you making this project?
To be honest with you, I'm a bit fed up with the state of affairs in LLM evals. We haven't had good tools for analyzing eval results, and the norm is that no one even considers running statistics, let alone running the right statistics for their data and research questions. As a result, we're basically flying blind. Even academic papers on ML benchmarks, which are supposed to be rigorous, don't generally conduct any statistical tests. That needs to change.
In January 2024, I did some deep thinking about this issue when trying to add error bars to ChainForge's plots, but then got busy with many other things. Come 2026, we're still in the same situation. No one seems to be working on this problem, yet from my perspective, it's basically the most pressing issue in AI evaluation today.
So, I'm hoping that by creating this guide and the accompanying library, I can help raise the standard for statistical analysis in LLM evals, and make it easier for developers to make informed decisions based on their eval results.
Downstream applications like ChainForge could integrate evalstats, or the methods this guide recommends,
to provide better statistical analysis and reporting for evals, and I hope other tools will do the same.
That said, I don't claim to have all the answers. I'm learning as I go, trying to ground recommendations in research and simulations, and updating this guide as I learn more. If you have any feedback or suggestions, I'd be open to hearing them.